Plot MAIC weights in a histogram with key statistics in legend using ggplot2
Source: R/matching.R
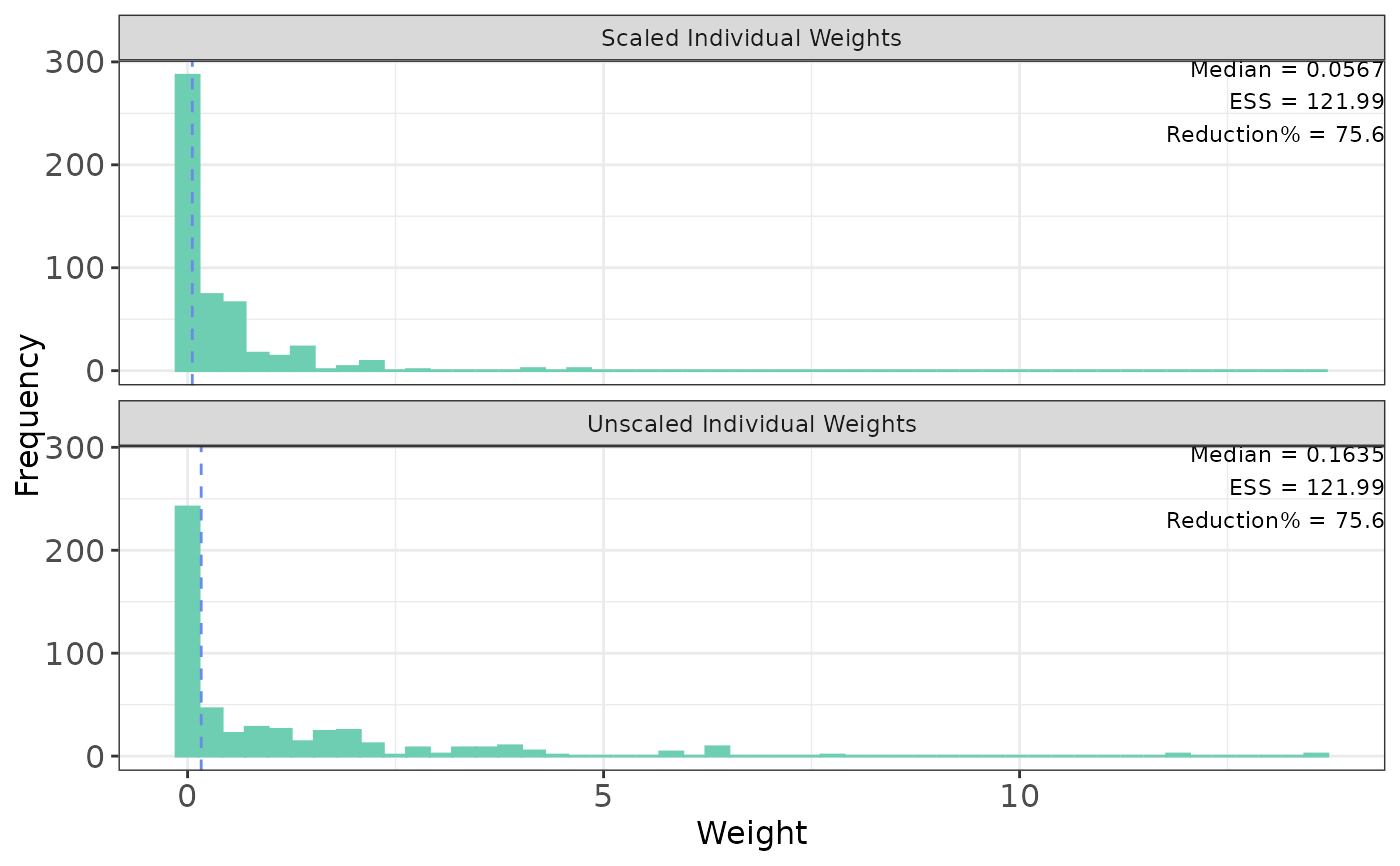
plot_weights_ggplot.RdGenerates a ggplot histogram of weights. Default is to plot both unscaled and scaled weights on a same graph.
Arguments
- weighted_data
object returned after calculating weights using estimate_weights
- bin_col
a string, color for the bins of histogram
- vline_col
a string, color for the vertical line in the histogram
- main_title
Name of scaled weights plot and unscaled weights plot, respectively.
- bins
number of bin parameter to use
Examples
if (requireNamespace("ggplot2")) {
  plot_weights_ggplot(weighted_sat,
    bin_col = "#6ECEB2",
    vline_col = "#688CE8",
    main_title = c("Scaled Individual Weights", "Unscaled Individual Weights"),
    bins = 50
  )
}