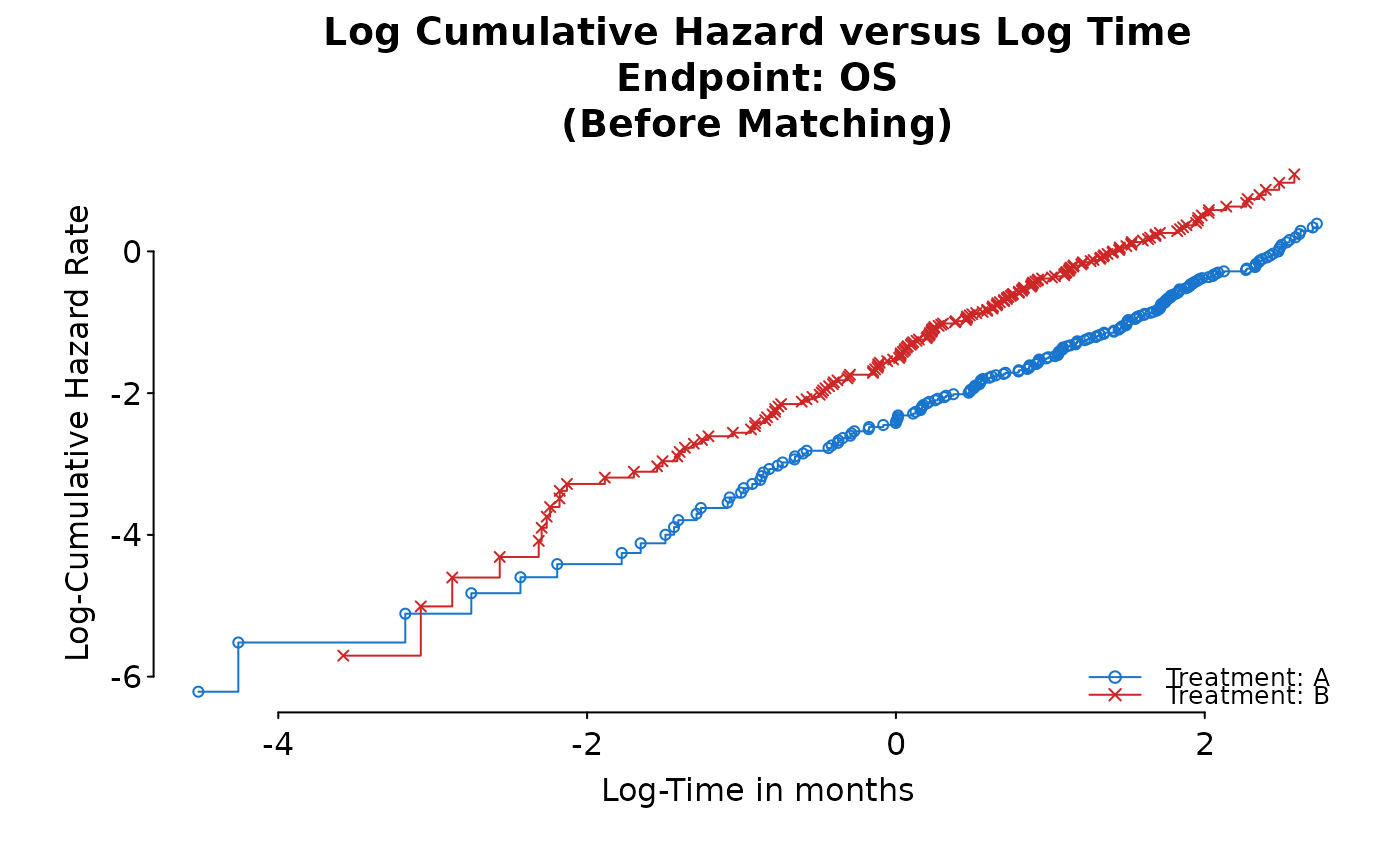
PH Diagnosis Plot of Log Cumulative Hazard Rate versus time or log-time
Source:R/plot_km.R
ph_diagplot_lch.RdThis plot is also known as log negative log survival rate.
Usage
ph_diagplot_lch(
  km_fit,
  time_scale,
  log_time = TRUE,
  endpoint_name = "",
  subtitle = "",
  exclude_censor = TRUE
)
Arguments
- km_fit
returned object from
survival::survfit- time_scale
a character string, 'years', 'months', 'weeks' or 'days', time unit of median survival time
- log_time
logical, TRUE (default) or FALSE
- endpoint_name
a character string, name of the endpoint
- subtitle
a character string, subtitle of the plot
- exclude_censor
logical, should censored data point be plotted
Examples
library(survival)
data(adtte_sat)
data(pseudo_ipd_sat)
combined_data <- rbind(adtte_sat[, c("TIME", "EVENT", "ARM")], pseudo_ipd_sat)
kmobj <- survfit(Surv(TIME, EVENT) ~ ARM, combined_data, conf.type = "log-log")
ph_diagplot_lch(kmobj,
  time_scale = "month", log_time = TRUE,
  endpoint_name = "OS", subtitle = "(Before Matching)"
)