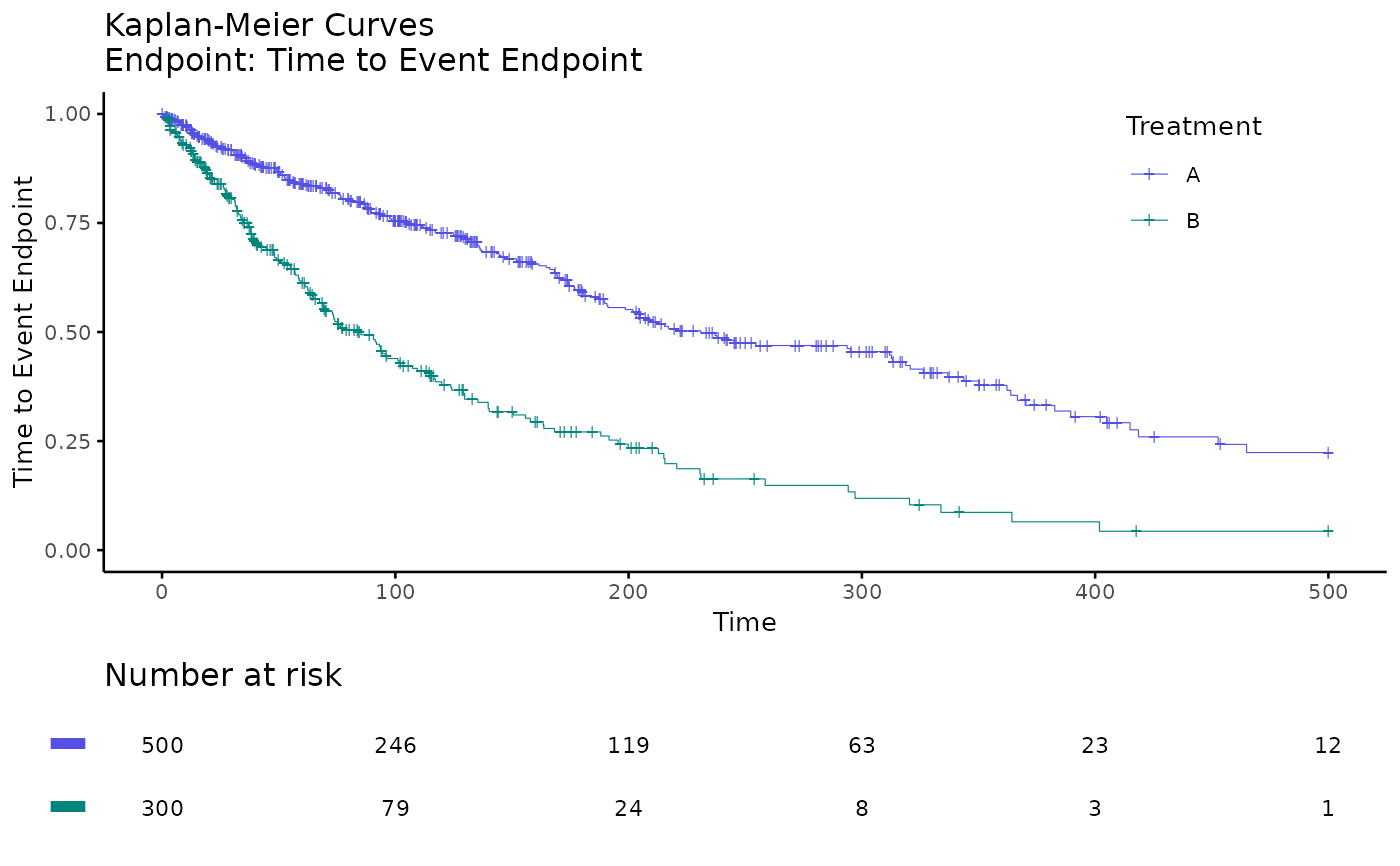
This function generates a basic KM plot using ggplot.
Usage
basic_kmplot2(
  kmlist,
  kmlist_name,
  endpoint_name = "Time to Event Endpoint",
  show_risk_set = TRUE,
  main_title = "Kaplan-Meier Curves",
  break_x_by = NULL,
  censor = TRUE,
  xlab = "Time",
  xlim = NULL,
  use_colors = NULL,
  use_line_types = NULL
)
Arguments
- kmlist
a list of
survfitobject- kmlist_name
a vector indicating the treatment names of each
survfitobject- endpoint_name
a string, name of time to event endpoint, to be show in the last line of title
- show_risk_set
logical, show risk set table or not, TRUE by default
- main_title
a string, main title of the KM plot
- break_x_by
bin parameter for
survminer- censor
indicator to include censor information
- xlab
label name for x-axis of the plot
- xlim
x limit for the x-axis of the plot
- use_colors
a character vector of length up to 4, colors to the KM curves, it will be passed to 'col' of
lines()- use_line_types
a numeric vector of length up to 4, line type to the KM curves, it will be passed to
ltyoflines()
Value
A Kaplan-Meier plot object created with survminer::ggsurvplot().
Examples
library(survival)
data(adtte_sat)
data(pseudo_ipd_sat)

kmobj_A <- survfit(Surv(TIME, EVENT) ~ ARM,
  data = adtte_sat,
  conf.type = "log-log"
)

kmobj_B <- survfit(Surv(TIME, EVENT) ~ ARM,
  data = pseudo_ipd_sat,
  conf.type = "log-log"
)

kmlist <- list(kmobj_A = kmobj_A, kmobj_B = kmobj_B)
kmlist_name <- c("A", "B")

basic_kmplot2(kmlist, kmlist_name)